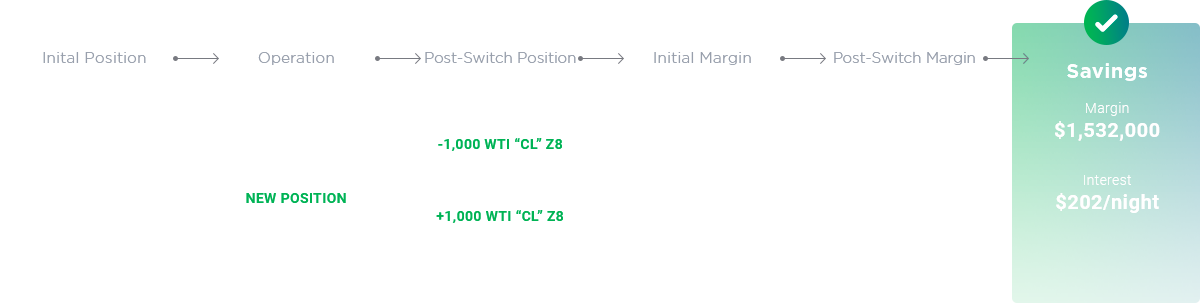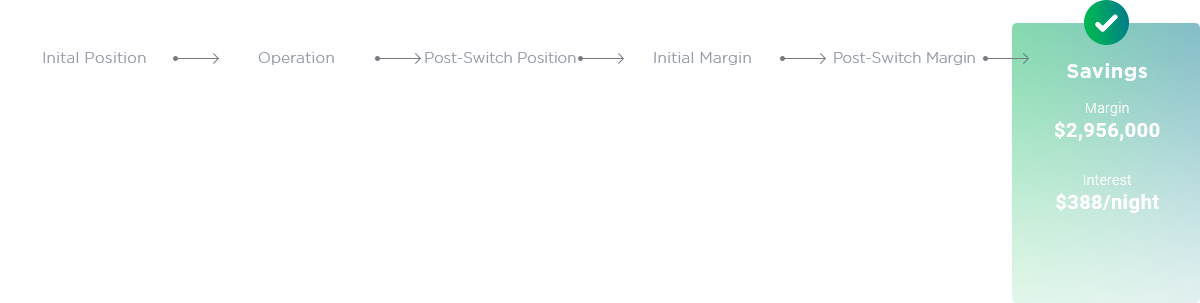
No prior position, initiate a switch position
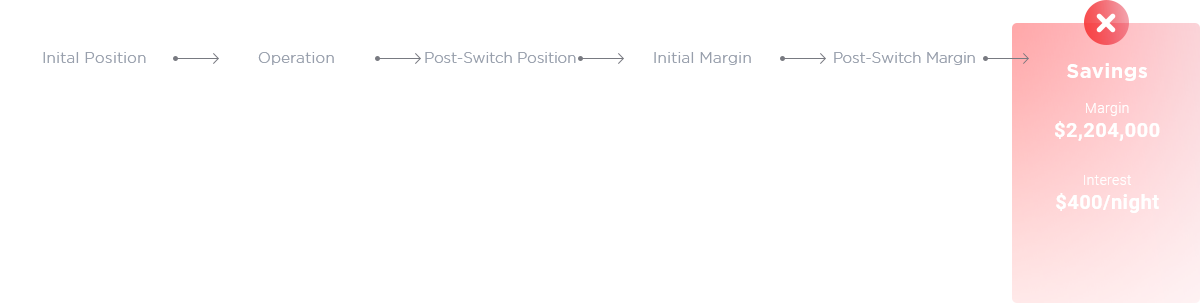
Switches you should NOT execute, despite apparent offsets
Transfer position from one FCM to another
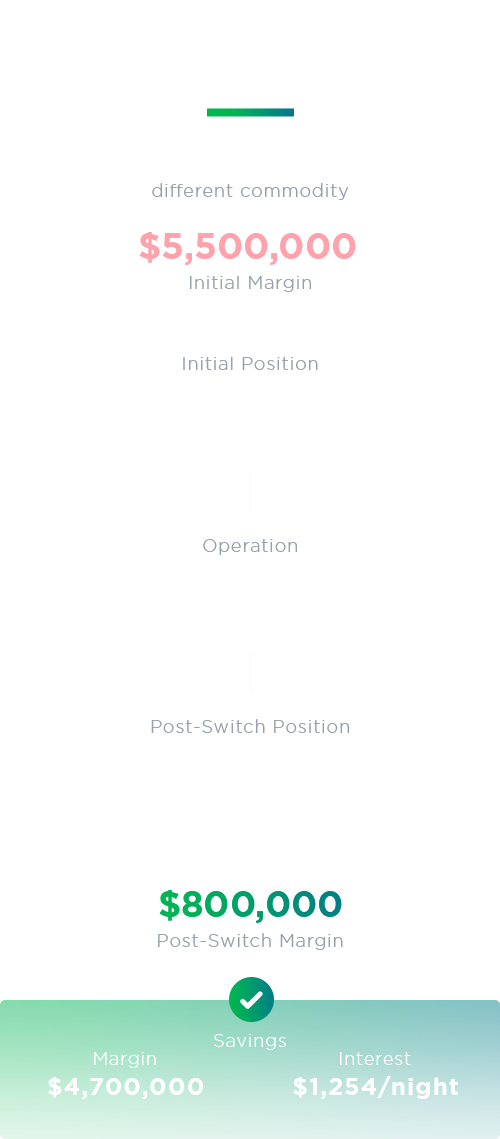
Same exact lookalike contract on Nymex vs ICE
Same exact lookalike contract; Nymex leg on FCM1; ICE leg on FCM2
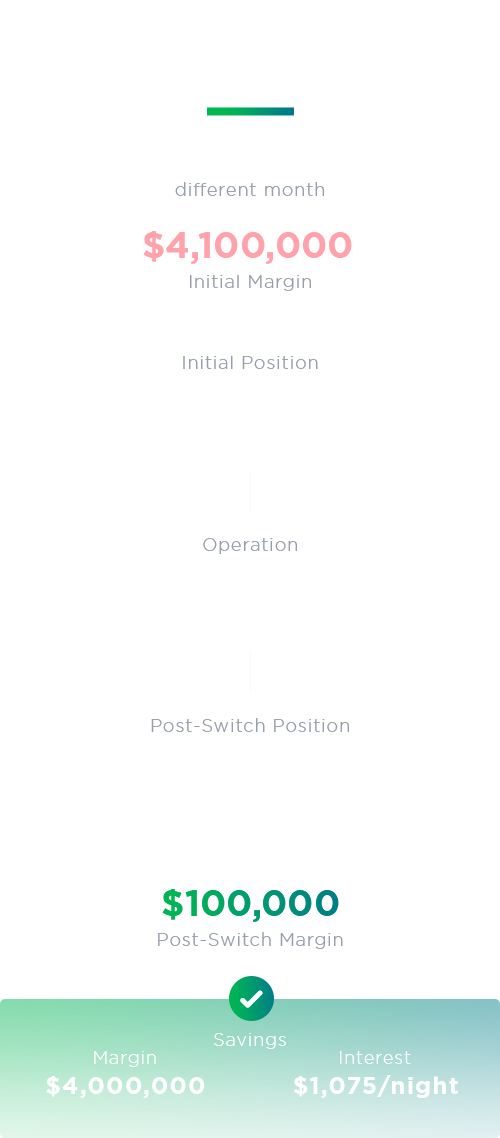
M/Z Nymex/ICE Switch Roll
Are you being correctly charged by your clearing broker
optimizes switch execution for position limit day
MF Global, Lehman, Peregrine
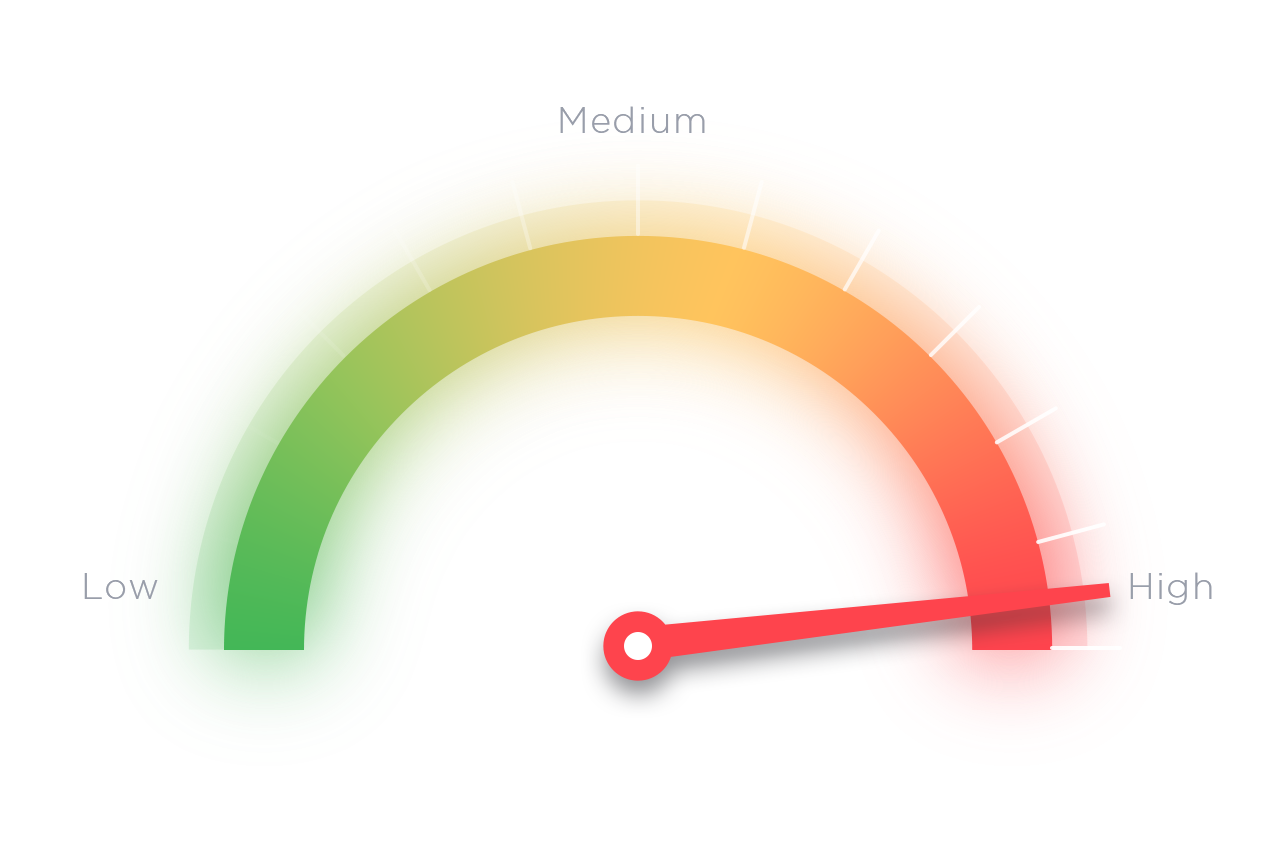
Monitor leverage ratio in real-time (e.g. Geneva Trading vs ABN)